

Dealing With Outliers

Robert Oppenheimer, Bill Gates, and The Beatles are arguably considered outliers. They have gone on to achieve extraordinary success in their respective fields, garnering the epithet 'Genius'.
Oppenheimer was the brains behind the atomic bomb that caused mayhem in Nagasaki and Hiroshima. Perhaps 'Evil Genius' is more befitting for Robert Oppenheimer, but I digress.
Bill Gates, the computer genius, founded Microsoft at only 20 years. Lastly, the Beatles impacted the 20th century in the arts, music, film, literature, and fashion on top of winning awards and accolades. You get the drift, don't you?
So who are outliers? In statistics, outliers are extremely high or extremely low values in a dataset. Outliers can affect the performance of a machine learning model drastically. Thus, it is important to understand how to identify and deal with them. Consider the following list of numbers:
the_list =[17, 1003, 20, 9, 15, 18, 13, 23, 7, 17, 12, 11]
The mean of the list is 97.08. The mean falls to 14.73 when 1003 is omitted from the list. Now think about this with income distribution in mind. The Kenya Bureau of Statistics in 2020 reported that 0.1% of the Kenyan population own more wealth than the 99.9% combined.
At the time of reporting, 0.1% of the population was approximately 8,300 people. Quite mind-blowing that a handful of Kenyans wield so much influence on how the economy is perceived.
Detecting Outliers
In our list above, we can clearly spot the outlier. As the dataset grows, this becomes increasingly difficult and time-consuming. Luckily, we can employ techniques that can help with this task.
1. Using Boxplots
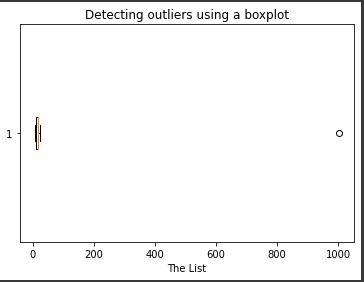
A boxplot is a standardized way of distributing data following the five-number summary, which consists of the minimum, first quartile, median, third quartile, and maximum.
A boxplot of our list looks as follows:
We achieve this using the following code:
import matplotlib.pyplot as plt

the_list = [17, 1003, 20, 9, 15, 18, 13, 23, 7, 17, 12, 11]
plt.boxplot(the_list, vert=False)
plt.title("Detecting outliers using a boxplot")
plt.xlabel('The List')
plt.show()
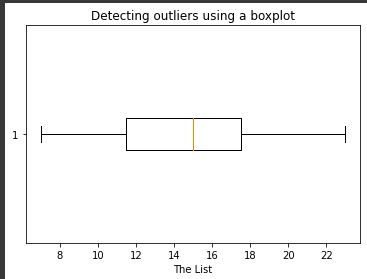
The boxplot without the outlier is as shown below:
2. Using Z-score
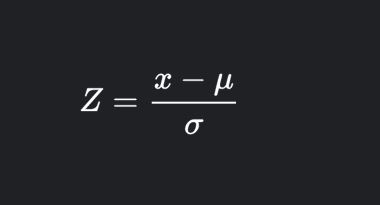
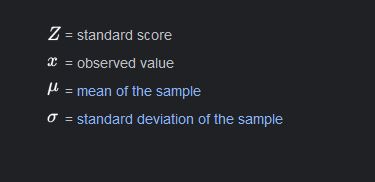
The z-score measures how far a value is from the mean. The formula for the z-score is:
where,
An absolute z-score of 3 is considered an outlier in a normal distribution.
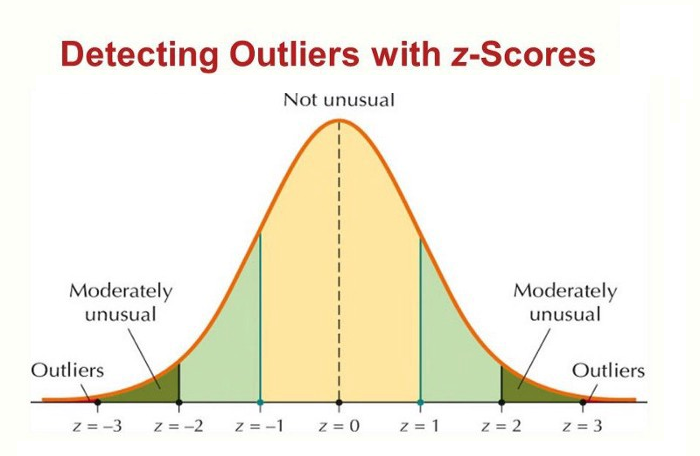 Image source
Implementing this in code is as shown below:
the_list = [17, 1003, 20, 9, 15, 18, 13, 23, 7, 17, 12, 11]
outlier_list = []
threshold = 3

mean = np.mean(the_list)
standard_deviation = np.std(the_list)


For i in the_list:
    z_score = (i-mean)/standard_deviation

    if (np.abs(z_score) > threshold):
        outlier_list.append(i)

print("Outliers in the list", outlier_list)
There are more methods used to detect outliers.
Handling Outliers
So now that you can identify outliers, what do you do with them? Do you eliminate them completely from the dataset? How would that affect the model? What if they are too important to drop?
Handling outliers is very specific to the objective of the project and the kind of data being used. For example, eliminating outliers would not be an option in time-series datasets. A dataset of power consumption with a sudden spike in consumption may indicate a fault or power surge instead of just representing a huge value that falls off the distribution curve.
Another example would be the case of Halima Cisse, who gave birth to 9 babies and currently holds the guniess world record for the nonuplets surviving birth.
When considering birth rates in Morocco, Halima becomes an outlier, and dropping her miraculous case would give a more accurate representation of the birthrate in the area. In this regard, dictating a singular approach to handling outliers would be an oversight.
Eliminating Outliers
in our list, eliminating outliers would have been done as follows:
outlier_list_set = set(outlier_list)
list_without_outliers = [x for x in the_list if x not in outlier_list_set]
This yields:
[17, 20, 9, 15, 18, 13, 23, 7, 17, 12, 11]
Mean/Median imputation
This method comes in handy when you want to avoid the mean, which is highly influenced by the outliers. As such the outliers are replaced by the median. We can modify the z-score code to replace all values with a z-score of an absolute value greater than or equal to three with the median of the list.
the_list = [17, 1003, 20, 9, 15, 18, 13, 23, 7, 17, 12, 11]
outlier_list = []
threshold = 3

mean = np.mean(the_list)
standard_deviation = np.std(the_list)
median = np.median(the_list)

for i in range(len(the_list)):
    z_score = (the_list[i]-mean)/standard_deviation
    if (np.abs(z_score) > threshold):
        outlier_list.append(the_list[i])
        the_list[i] = median

print("Outliers in the list", outlier_list)
print("New list is ",the_list)
Quantile-Based Flooring and Capping
This technique converts values that are lesser than the 10th percentile into the 10th percentile value and values greater than the 90th percentile value are converted to the 90th percentile value.
the_list = [17, 1003, 20, 9, 15, 18, 13, 23, 7, 17, 12, 11]
tenth_percentile = np.percentile(the_list, 10)
ninetieth_percentile = np.percentile(the_list, 90)
new_list = np.where(the_list<tenth_percentile, tenth_percentile, the_list)
new_list = np.where(new_list>ninetieth_percentile, ninetieth_percentile, new_list)

print("New list:",new_list)
This yields:
New list: [17. 22.7 20. 9.2 15. 18. 13. 22.7 9.2 17. 12. 11. ]
Yeap! that's all for this blog. Happy hacking!


