


Harnessing Python for Anti-Money Laundering (AML) and Fraud Detection in Banking
An introductory Step-by-Step Python Tutorial into AML in the financial sector.


Money Laundering for Dummies
Imagine you have a lemonade stand in a fancy shopping mall. But instead of selling real lemonade, you just pretend to sell it. You set up a nice stand with pictures of lemonade and cups and a cash register, but you never actually make any lemonade or give any to customers. Or if you do, it's not nearly enough to even pay your light bills, let alone your rent.
Now, let's say you have a big jar of coins at home that you got by doing something you shouldn't have, like picking up a dropped wallet and not handing it over. You need a way to make it look like your coins came from selling lemonade at your stand, not from the lost wallet.
Here's what you do:
Each day, you take some of those coins from your jar and put them in the cash register at your lemonade stand.
Then, when you go home, you tell your parents that you sold lots of lemonade and show them the coins in the register.
Your parents think, "Wow, our kid is doing a great job selling lemonade!" They have no idea that the money actually came from the lost wallet, not selling lemonade. The fancy lemonade stand in the busy mall makes it look believable because everyone thinks, "Who wouldn't buy lemonade in such a nice place?"
This practice of playing pretend and putting your "lost wallet" money in the store's register to make it look like it came from selling products is what money laundering is in a nutshell. You are tricking people into thinking your money was earned by selling stuff at the store, just like you tricked your parents into thinking you sold lemonade.
It’s done in three stages, i.e
Placement: Bringing dirty money into the financial system
Layering: introducing ‘layers’ or separation between the source crime generating the dirty money and the money in the financial systems.
Integration: reintroducing laundered money from the financial system back into the economy. It is now considered clean money and can be used freely.
In this tutorial, we do a very basic dive into how we can use Python to flag and potentially prevent this ill-gotten money from getting into the financial system. Grab a glass, join us at SCA-Nairobi, and see if we can get some lemonade from these lemons.
Introduction
In the ever-evolving landscape of the banking sector, financial institutions are constantly under the threat of money laundering and financial fraud. The introduction of Anti-Money Laundering (AML) and know-your-customer (KYC) regulations mandates banks implement rigorous checks to prevent such illicit activities. Python, with its vast ecosystem of libraries and data science methodologies, offers powerful tools to aid in these efforts.
In this tutorial, we will explore how Python can be utilized to automate the detection of suspicious transactions indicative of money laundering. This approach not only streamlines compliance efforts but also enhances the overall security and integrity of financial operations.
Prerequisites:
basic understanding of Python programming
Familiarity with pandas and sci-kit-learn libraries
An environment to run Python code (e.g., Jupyter Notebook, PyCharm)
DISCLAIMER: This is a very basic example to help you understand how this could potentially be done. Real-world AML involves way more complex techniques and regulations. However, it provides a starting point to understand how code empowers banks to combat financial crime.
Step 1: Data Generation
We begin with a Python script designed to generate a synthetic dataset of financial transactions. This dataset simulates a scenario where there are regular transactions interspersed with outliers and frequent transactions from specific customers, which could potentially indicate suspicious activities. The script utilizes Python's pandas and NumPy libraries to create and manipulate data effectively.
Here’s the code snippet for this step. We will go through it line by line later on.
import pandas as pd
import numpy as np

# Seed for reproducibility
np.random.seed(0)

# Generate dates up to the current day
end_date = pd.to_datetime("today")
start_date = end_date - pd.DateOffset(years=1)
dates = pd.date_range(start=start_date, end=end_date, freq='D')

# Generating transactions
data = {
  'customer_id': np.random.choice(a=range(100, 200), size=len(dates), replace=True),
  'transaction_amount': np.random.exponential(scale=100, size=len(dates)).round(2),
  'transaction_date': dates
}

# Introduce explicit outliers
outliers = pd.DataFrame({
  'customer_id': np.random.choice(a=range(100, 110), size=20, replace=True),
  'transaction_amount': np.random.exponential(scale=3000, size=20).round(2) + 3000,
  'transaction_date': np.random.choice(dates, size=20, replace=False)
})

# Introduce frequent transactions for specific customers
frequent_customer_ids = [101, 102, 103, 105, 99]
frequent_dates = pd.date_range(start=start_date, end=end_date, freq='H')[:500]
frequent_customers = pd.DataFrame({
  'customer_id': np.random.choice(frequent_customer_ids, size=500, replace=True),
  'transaction_amount': np.random.exponential(scale=100, size=500).round(2),
  'transaction_date': frequent_dates
})

# Combine data, outliers, and frequent transactions
data = pd.DataFrame(data)
data = pd.concat([data, outliers, frequent_customers], ignore_index=True)

# Shuffle the data to mix transaction types
data = data.sample(frac=1).reset_index(drop=True)

# Save to CSV
data.to_csv("sca_transactions.csv", index=False)

print("Enhanced dataset created with outliers and frequent transactions saved to 'sca_transactions.csv'.")
Here's a breakdown of what each part of the script does:
Import Libraries
The script begins by importing pandas and numpy. Pandas is used for data manipulation and analysis, while NumPy is used for numerical operations.
import pandas as pd
import numpy as np
Set a random seed.
Setting a random seed ensures that the results are reproducible. This means that every time you run the script with the same seed, you will get the same random numbers. Change this at will.
np.random.seed(0)
Generating Date Range
The script generates a range of dates from one year ago to today. This forms the time basis for the transactions, ensuring that every transaction has a timestamp. This is necessary for time analysis.
end_date = pd.to_datetime("today")
start_date = end_date - pd.DateOffset(years=1)
dates = pd.date_range(start=start_date, end=end_date, freq='D')
Create Regular Transaction Data
We create a dictionary with three keys: customer_id, transaction_amount, and transaction_date. Random customer IDs are selected from a specified range, transaction amounts are generated following an exponential distribution (commonly used to model transaction sizes), and dates are assigned from the previously generated date range.
data = {
    'customer_id': np.random.choice(a=range(100, 200), size=len(dates), replace=True),
    'transaction_amount': np.random.exponential(scale=100, size=len(dates)).round(2),
    'transaction_date': dates
}
Introducing Outliers
Outliers represent transactions that are unusually high and could be suspicious. These are also generated using an exponential distribution but scaled significantly higher. These outlier transactions are assigned to random dates within the same date range and to a subset of the customer IDs.
outliers = pd.DataFrame({
    'customer_id': np.random.choice(a=range(100, 110), size=20, replace=True),
    'transaction_amount': np.random.exponential(scale=3000, size=20).round(2) + 3000,
    'transaction_date': np.random.choice(dates, size=20, replace=False)
})
Introduce Frequent Transactions for Specific Customers
Here we create additional transactions for a few selected customer IDs to simulate customers who transact more frequently than others—a potential red flag for money laundering activities. These transactions are more numerous and occur at hourly intervals. Again, this in and of itself is not the sole indication of laundering. This is just an example of this tutorial.
frequent_customer_ids = [101, 102, 103, 105, 99]
frequent_dates = pd.date_range(start=start_date, end=end_date, freq='H')[:500]
frequent_customers = pd.DataFrame({
    'customer_id': np.random.choice(frequent_customer_ids, size=500, replace=True),
    'transaction_amount': np.random.exponential(scale=100, size=500).round(2),
    'transaction_date': frequent_dates
})
Combine Data and Shuffle
All data sections—regular transactions, outliers, and frequent transactions—are combined into a single pandas DataFrame. This combined data is then shuffled to randomize the order of transactions, mimicking a more realistic transaction log than saving the file.
data = pd.DataFrame(data) data = pd.concat([data, outliers, frequent_customers], ignore_index=True) data = data.sample(frac=1).reset_index(drop=True) data.to_csv("sca_transactions.csv", index=False)
Congratulations, You have utilized simple yet powerful Python data generation techniques to come up with a dummy dataset. We will use this file for the next part of this tutorial.
Step 2: Analysis
In this section, we analyze the synthetic transaction dataset we generated in Step 1. Our goal is to identify potentially suspicious transactions by examining the amount and frequency of transactions per customer. We will use pandas for data handling and matplotlib for visualizations, where applicable.
Here’s the code snippet for this last step. We will go through it line-by-line later.
# Load data from CSV file
data = pd.read_csv("sca_transactions.csv")

# Add date parsing for transaction date filtering
data['transaction_date'] = pd.to_datetime(data['transaction_date'])

# Define the current date and filter data for the last year only
current_date = pd.Timestamp('today')
data = data[data['transaction_date'] >= current_date - pd.DateOffset(years=1)]

# Analyze transaction amounts
# Calculate average and standard deviation for transaction amount
avg_transaction = data['transaction_amount'].mean()
std_transaction = data['transaction_amount'].std()

# Define a threshold as mean + 3*standard deviation
threshold = avg_transaction + 3 * std_transaction
suspicious_transactions = data[data['transaction_amount'] > threshold]

# Analyze transaction frequency by customer
# Group data by customer ID and count transactions per customer
customer_transactions = data.groupby("customer_id")["transaction_amount"].count()

# Define high frequency threshold as 95th percentile of transaction frequency
high_freq_threshold = customer_transactions.quantile(0.95)
frequent_transactions = customer_transactions[customer_transactions > high_freq_threshold]

# Output results
print("List of transactions exceeding the threshold:")
print(suspicious_transactions)

print("\nList of customers with high transaction frequency:")
print(frequent_transactions)
Here’s a detailed breakdown of what each part of the script does:
Load and Prepare Data
We load the dataset from the file into a pandas DataFrame. We then convert the transaction dates to pandas' datetime format to facilitate time-based filtering and analysis.
data = pd.read_csv("sca_transactions.csv")
data['transaction_date'] = pd.to_datetime(data['transaction_date'])
Filter Data Based on Date
The script filters the transactions to include only those from the last year. This is done by defining the current date and using it to filter out transactions that are older than one year.
current_date = pd.Timestamp('today')
data = data[data['transaction_date'] >= current_date - pd.DateOffset(years=1)]
Analyze Transaction Amounts
This is the most crucial bit. Here, the average and standard deviation of the transaction amounts are calculated to establish a threshold for identifying unusually high transactions, which could be suspicious. These statistics help us understand the typical transaction size and the variability of transaction amounts.
A threshold is set at three times the standard deviation above the mean. This is based on the statistical rule that in a normal distribution, about 99.7% of the data lies within three standard deviations from the mean. Transactions that exceed this threshold are likely to be outliers and could be suspicious.
Transactions exceeding this threshold (mean + 3*standard deviation) are considered potentially suspicious and are singled out for further examination. The rationale behind multiplying by 3 is that we want to capture values that fall outside the range of what's considered "normal" based on the average and standard deviation.
avg_transaction = data['transaction_amount'].mean()
std_transaction = data['transaction_amount'].std()
threshold = avg_transaction + 3 * std_transaction
suspicious_transactions = data[data['transaction_amount'] > threshold]
Analyze Transaction Frequency by Customer
Additionally, we aggregate the transaction data by customer ID to count the total number of transactions per customer. We then determine a high-frequency threshold as the 95th percentile of transaction frequency. Customers with transaction counts above this threshold are flagged for potential review as unusual patterns of activity.
As we calculate the 95th percentile of transaction frequencies, what we end up doing is setting a benchmark to identify the top 5% of customers with the highest transaction counts. These counts can be unusually high and may indicate potential structuring or smurfing activities (breaking up large transactions into smaller ones to avoid detection).
customer_transactions = data.groupby("customer_id")["transaction_amount"].count()
high_freq_threshold = customer_transactions.quantile(0.95)
frequent_transactions = customer_transactions[customer_transactions > high_freq_threshold]
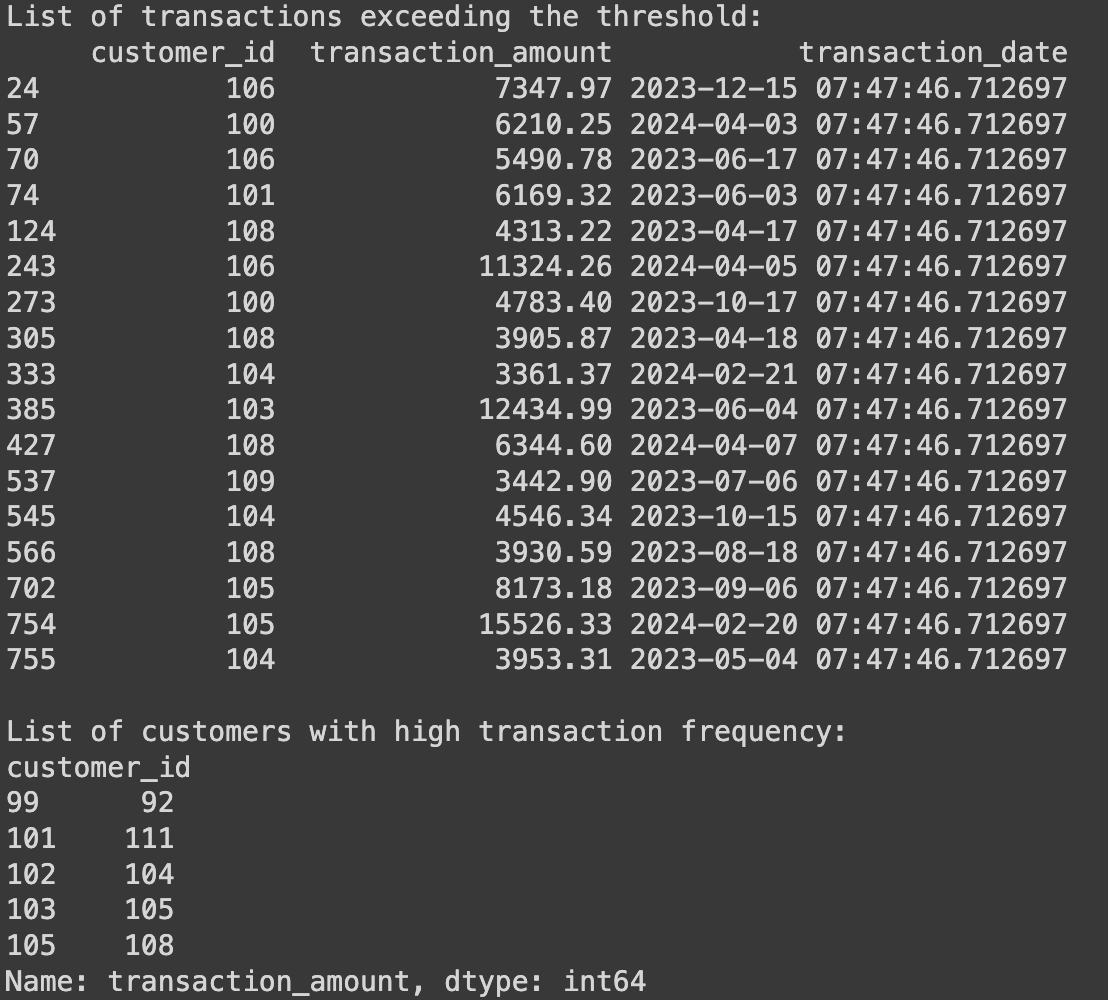
Output Results
Lastly, we print out the lists of transactions and customers that meet the criteria for being potentially suspicious. These outputs serve as a preliminary step for further investigation or review.
print("List of transactions exceeding the threshold:")
print(suspicious_transactions)

print("\nList of customers with high transaction frequency:")
print(frequent_transactions)
Overall, these analyses help identify potential red flags for money laundering:
High transaction amounts: Transactions exceeding the threshold might indicate attempts to move large sums of illicit funds in a single transaction to avoid detection.
High transaction frequency: Customers with an unusually high number of transactions compared to others could be involved in structuring, which is the process of breaking down large sums of money into smaller transactions to avoid triggering AML reporting requirements.
Conclusion
Together, these methods provide a robust way to screen for suspicious activities in financial transactions. By setting quantitative thresholds for what constitutes unusual activity—either in transaction size or frequency—financial institutions can effectively target their monitoring efforts, improving compliance and reducing the risk of facilitating illicit activities. This approach is an essential component of a comprehensive AML/KYC strategy.