

Implementing a Full Cycle Business Intelligence (BI) Project.
A step by step guide from Raw Data to Strategic Insights.

Hi, I'm Agin. A high-performing professional keen to experience the front-line realities of evidence-informed decision-making through Data Science, ML and AI. I am a Google Analyst, Certified Ads Professional, a Certified Analytics professional and a certified IBM AI Analyst.
Preface
Hi there. Ever heard of the phrase, 'Data is the new oil'? Well, in this article we will handle the refinery process. Imagine having a vast oil field, but no way to refine it into the liquid gold that fuels your business decisions. Welcome to the blind world of data without Business Intelligence (BI). In today's data-driven age, the ability to transform raw data into valuable insights is a ticket to success.
This article is a treasure map to navigate the fascinating landscape of Business Intelligence. We will walk together from the depths of data collection, through the refining process of data warehousing, to the glittering goldmine of actionable dependable insights. Grab your thinking hat, subscribe to the SheCodeAfrica Nairobi blog, and join me as I take you through this tale of data, dashboards, and discovery.
"In God We Trust, In Data We Verify"
Introduction
The world today relies heavily on data-driven decision-making, making Business Intelligence (BI) projects crucial for organizations seeking to gain a competitive edge. This comprehensive guide takes us through the step-by-step process of implementing a full-fledged BI project. It provides a guide on how to implement a BI project on Ubuntu Server 20.04 LTS using Talend, PostgreSQL, and Tableau.
Tools and Technologies
The following tools and technologies will be used in this BI project implementation. For purposes of this article, we will not go in-depth into the setup process for each of these tools. We will cover individual tool setup and configuration in detail in future articles.
For scalability, performance, and risk reduction in case one server fails, we have provisioned 3 servers/virtual machines. Each of the provisioned instances runs the BI lifecycle tool.
The first one is a Linux instance running Talend
The second instance runs PostgreSQL
The third instance is a Windows Server VM running Tableau
Talend: Talend is an open-source data integration platform that can be used to extract, transform, and load (ETL) operations. It is especially well-suited for organizations looking for an open-source, easy-to-use, and scalable ETL tool.
PostgreSQL: PostgreSQL is a free and open-source relational database management system (RDBMS). It will be used to store and query the data warehouse.
Tableau: Tableau is a data visualization platform that allows users to create interactive dashboards and reports. We will use the Windows Server OS for this installation.
Ubuntu Server 20.04 LTS: This Linux distribution is well-suited for running server applications. It offers stability, scalability, and resilience suited for this kind of project.
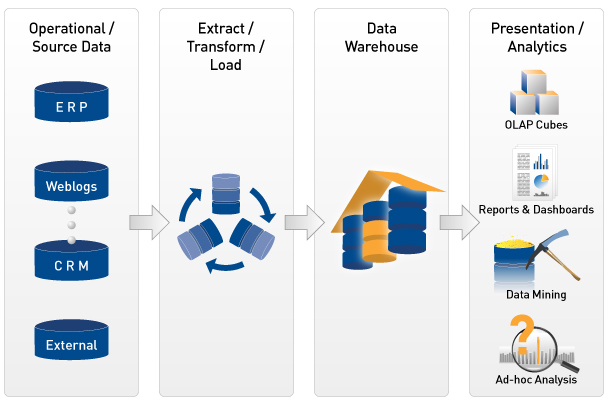
BI Project Lifecycle. Source: ZappySys
Stage 1: Data Extraction with Talend
Our journey begins with data extraction. Talend, a powerful ETL (Extract, Transform, Load) tool, is our weapon of choice. Operating on an Ubuntu Server 20.04 LTS environment, we leverage Talend's capabilities to extract data from a myriad of data sources.
First, we connect to the source system. Talend provides connectors for various data sources, including relational databases, flat files, cloud storage, and SaaS applications.
Talend also offers several connectors for popular data sources and targets. This can make it easy to connect to existing data systems. Moreover, it also offers many pre-built components for common ETL tasks. Additionally, it is open source (a major advantage for organizations with limited budgets), easy to use, highly scalable, and with vibrant community support groups.
Stage 2: Data Transformation and Loading
With data in hand, it's time for transformation and loading. Talend continues to be our ally in this phase. We employ transformations, such as data cleansing, enrichment, and aggregation, to ensure data quality.
Once a connection from the source system is established, Talend can then be used to perform extraction. This is made possible by the availability of a variety of components for data extraction, such as the tDBInput component for extracting data from relational databases and the tFileInputDelimited component for extracting data from flat files.
We may need to perform transformations on the data before loading it into the target system. This stage may encompass cleansing the data, filtering the data, or converting the data to a different format. Talend provides a variety of components for data transformation, such as the tMap component for mapping data fields between different formats and the tFilterRow component for filtering data rows based on certain criteria.
Once the transformation is done, we then proceed and load data into the target system. Talend also provides a variety of components for data loading, such as the tDBOutput component for loading data into relational databases and the tFileOutputDelimited component for loading data into flat files.
Here is an example of a simple data transformation and loading job in Talend:
tDBInput --> tMap --> tDBOutput
This job extracts data from a relational database table (tDBInput), transforms the data using a tMap component, and then loads the transformed data into a different relational database table (tDBOutput).
We will go more in-depth into Talend job creation and Talend components in subsequent articles so be sure to subscribe to this space.
Stage 3: Building Data Models
To derive meaningful insights, data models play a pivotal role. We design and implement data models within PostgreSQL, enabling us to slice and dice data efficiently. This stage and the one following it lay the foundation for creating reports and dashboards in the future.
Here are some general steps to follow:
Identify the entities and relationships in our data. What are the different types of data that we need to store? How are these types of data related to each other?
Design a normalized data model. This means breaking down our data into smaller, more manageable tables. Each table should represent a single entity and the relationships between entities should be represented by foreign keys.
Choose the right data types for each column. PostgreSQL offers a wide range of data types, so we need to choose the right type for each column in our database. This will help to ensure that our data is stored efficiently and accurately.
Create constraints on our tables. Constraints can be used to enforce data integrity and ensure that our data is valid. For example, we can use a constraint to require that a certain column is always unique e.g. the member ID of SCA Nairobi members.
Create indexes on our tables. Indexes can be used to improve the performance of queries. An example would be to create an index on a column that is frequently used in WHERE clauses.
Here is an example of a simple data model for the SCA Nairobi blog website:
|
This data model consists of two tables: users and posts. The users table stores information about the users of the blog website, such as their usernames and email addresses. The posts table stores information about the posts on the blog website, such as the title, content, and author. The author_id column in the posts table is a foreign key that references the id column in the users' table. This allows us to identify the author of each post easily.
Once we have created our data model, we can load data into our database using the PostgreSQL COPY command or an ETL tool. We can then query and analyze our data using an SQL client or a BI tool of our choice.
Stage 4: Data Warehousing with PostgreSQL
PostgreSQL is our chosen relational database management system (RDBMS) for the data warehousing solution. Running on Ubuntu 20.04 LTS, it provides a robust platform for data storage and management. Being open-source, scalable, and reliable, it is one of the best tools for this stage. Additionally, it is backed by a feature-rich arsenal that is useful for data warehousing. These include support for complex data types, built-in data compression, and materialized views.
Designing our Data Warehouse (DW)
When designing a PostgreSQL data warehouse, it is important to consider the following factors:
Data model: The data model should be designed to meet the specific needs of the data warehouse. It should be optimized for querying and analysis.
Table partitioning: Table partitioning can be used to improve the performance of queries on large tables.
Indexes: Indexes can be used to improve the performance of queries that filter or sort the data.
Materialized views: Materialized views can be used to pre-compute the results of common queries. This can improve the performance of these queries.
Loading data into our Data Warehouse (DW)
Once the DW has been designed, loading data into it can be done using a variety of methods, such as:
ETL tool: An ETL (extract, transform, and load) tool can be used to extract the data from the source systems, transform it into the required format, and load it into the data warehouse. In our case we used Talend.
PostgreSQL COPY command: The PostgreSQL COPY command can be used to load data from a flat file into a PostgreSQL table.
Foreign data wrappers: PostgreSQL foreign data wrappers can be used to access data in external systems without having to import it into the data warehouse.
Querying and analyzing data in the Data Warehouse (DW)
Once the data has been loaded into the data warehouse, it can be queried and analyzed using a variety of tools, such as:
SQL client: A SQL client such as DBeaver, PgAdmin4, or phpMyAdmin can execute SQL queries against the data warehouse.
BI tool: A BI tool e.g. Tableau, Qlik, or PowerBI can be used to create dashboards and reports from the data warehouse.
Python: Python can be used to query and analyze the data warehouse using the psycopg2 library.
Stage 5: Visualisation
At this point, we are in the last stages of the pipeline. The data is assumed to be clean and ready for user consumption. This is where visualization tools come in.
Gartner provides an in-depth yearly review of these tools and their current market standing. Be sure to check it out.
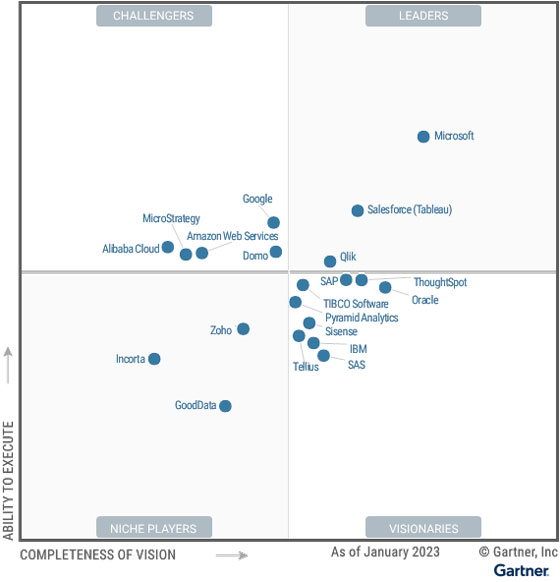
2023 Gartner® Magic Quadrant™ for Analytics and Business Intelligence Platforms
For this project, we will use Tableau. We connect Tableau to our PostgreSQL data warehouse. Using Tableau's drag-and-drop interface, we create interactive and insightful reports and dashboards that enable users to explore real-time data effortlessly anywhere anytime.
Stage 6: Real-time Monitoring and Maintenance
Lastly, our BI project wouldn’t be complete without a strategy for real-time monitoring and maintenance. To ensure data accuracy, performance optimization, and system security it is prudent to do the following:
Use a monitoring dashboard: This provides us with a real-time overview of the performance of our BI system. This dashboard typically includes metrics such as CPU usage, memory usage, disk usage, and query response times.
Set up alerts: After deployment, we set up alerts to notify us of any problems with our BI system, such as performance problems or data quality issues. This will allow us to quickly identify and resolve any problems before they impact our users.
Schedule Regular Maintenance: Schedule regular maintenance Tasks such as applying security patches, updating software, reorganizing and rebuilding indexes, and deleting old data should be set on a regularly scheduled maintenance timeline. This will help to keep our BI system running smoothly and efficiently.
Use a BI platform that supports real-time monitoring and maintenance: When choosing which platform to use, we could prioritize some BI platforms, such as Tableau and QlikView, that offer built-in support for real-time monitoring and maintenance. This can make it easier to monitor and maintain our BI system.
Conclusion
Implementing a full Business Intelligence project is a rewarding journey. It empowers you to make data-driven decisions that drive growth and efficiency. By following these steps and utilizing the right tools, you will be well-equipped to start your transformation today and turn raw data into actionable insights that fuel your organization's success.
From SCA Nairobi and I, we wish you all the best on your journey to data-driven growth, where insights lead the way. Remember, In God We Trust, and In Data we Verify, always counter-check those figures before presenting them.
This is it from me. See you on the next one. Stay Safe and be Kind.


